Length: Approximately 315 meters (1,033 feet)
Beam (Width): About 75 meters (246 feet) at its widest point
Displacement: Around 70,000 tons (full load)
The Shandong is designed with a ski-jump ramp to launch aircraft, similar to China’s other carrier, the Liaoning. It primarily operates J-15 fighter jets, helicopters, and other support aircraft. Though smaller than the U.S. Navy’s supercarriers, it is still a significant platform for China’s naval capabilities.
Length: Approximately 320 meters (1,050 feet)
Beam (Width): Around 78 meters (256 feet)
Displacement: Estimated at 80,000 to 100,000 tons (full load)
The Fujian is China’s first carrier equipped with electromagnetic catapults (similar to the U.S. Navy’s technology), allowing for faster and more efficient aircraft launches compared to the ski-jump ramps used on earlier carriers. This places it closer in capability to the U.S. Navy’s supercarriers.
In terms of size, the Fujian is roughly comparable to the U.S. Navy’s Gerald R. Ford-class carriers.

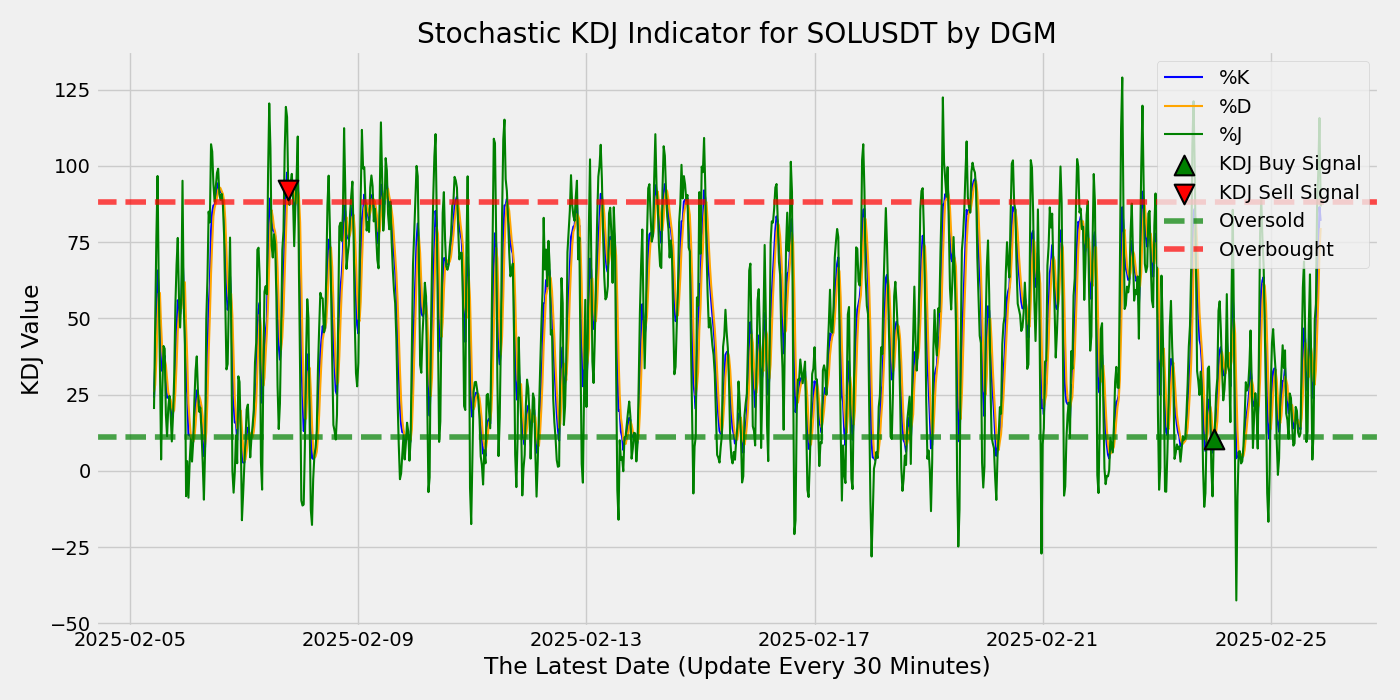
KDJ Indicator is a technical analysis tool derived from the Stochastic Oscillator, used to determine market trends and potential turning points. It adds an extra dimension (the J line) to the traditional stochastic indicator, making it more sensitive to market movements. Here’s how it works:
- K Line:
- The primary moving average in the KDJ indicator, similar to the %K line in the Stochastic Oscillator. It represents the relative position of the current price within the high-low range over a specified period.
- D Line:
- The secondary moving average, similar to the %D line in the Stochastic Oscillator. The D line is a smoothed version of the K line and is used as a signal line to identify buy or sell signals. When the K line crosses above the D line, it’s a bullish signal, and when it crosses below, it’s bearish.
- J Line:
- The unique component of KDJ. The J line represents the divergence of the K and D lines, and it can move outside the range of 0 to 100. It’s more volatile and can sometimes give early buy or sell signals by predicting overbought and oversold conditions more aggressively.
Interpretation:
- Buy Signal: When the K line crosses above the D line, especially when the J line rises sharply, it’s considered a bullish signal.
- Sell Signal: When the K line crosses below the D line and the J line drops, it’s considered a bearish signal.
- Overbought/Oversold: Similar to the Stochastic Oscillator, values above 80 may indicate an overbought market, and values below 20 may indicate an oversold market.
The J line makes the KDJ more responsive to price changes compared to traditional oscillators, but it also increases the likelihood of false signals due to its sensitivity. Traders often combine KDJ with other indicators to confirm trends.
